

On this page
Investigate data quality
Interpret the Golden Quality screen — the average and its trend, the ranked problems, the score distribution, and measurement coverage.
Open an entity’s Quality section to inspect a saved picture of its data quality. A picture can come from the daily schedule or an on-demand measurement, including the one taken when Aurelia is installed. The record’s Quality tab answers a different question: how that record’s current values measure now.
Check which picture you are reading
Read the picture’s date, time, and included-record count before interpreting its figures. Golden initially shows the newest available picture in the selected time window. A historical picture keeps its original values after a record is corrected.
To choose another picture:
- Select Change beside the displayed picture.
- In Quality pictures, filter by All, Scheduled, or On demand.
- Select the row you want to inspect. Compare its time, label, average, measured-record count, and records with an error.
- Select Show this picture to apply the selection.
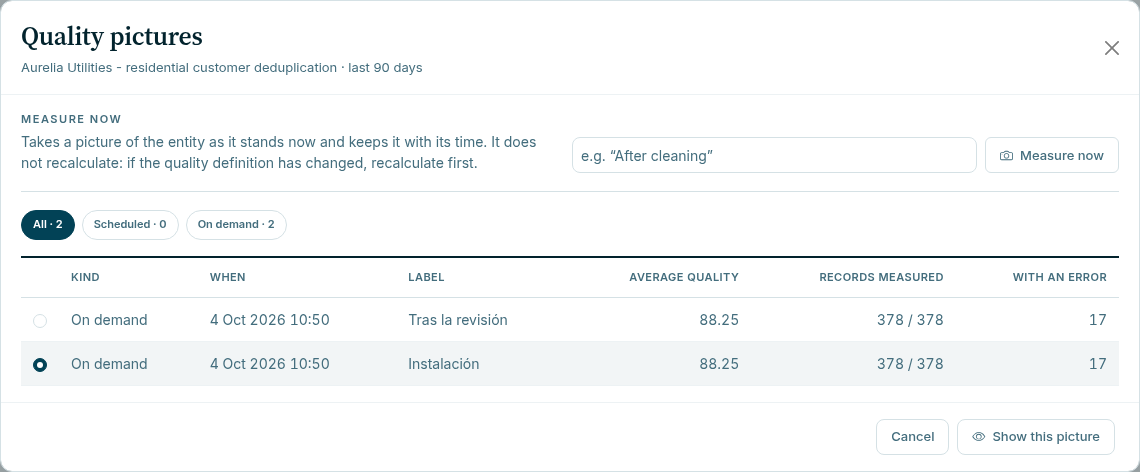
Selecting a row alone does not change the page. Points in the trend chart show tooltips; they do not select a picture. The selected picture determines the average, coverage, distribution, and issue ranking together.
A page with no picture has no saved observation to display; this is not a score of zero. A missing entity table is a separate configuration problem. Aurelia should have an initial picture when installation finishes: inspect the installation task if it does not.
Take a new measurement
Administrators can open Change, optionally enter a label in Measure now, and select the Measure now button. The label can contain up to 120 characters. Golden starts a background task and the page shows the new picture when it completes. If it fails, inspect the task message; a queued request is not a completed measurement.
Measuring saves the current aggregate state of one entity’s table. It does not recalculate stored record scores. If the quality definition has changed, bring the record calculations up to date first, then take a new measurement. See Configure validation and quality.
STEWARD and VIEWER can read permitted quality pictures but cannot request a
new measurement. Administrators should use a label such as “After phone
correction” to explain the reason for an observation.
Interpret the average and trend
The average uses records whose stored quality matches the picture’s definition. Coverage below 100% means it describes only that portion of the table. Compare the record-count trend alongside quality: an influx of new data and a correction to existing data have different explanations.
Scheduled snapshots describe closed UTC days. On-demand pictures carry their actual measurement time and remain distinguishable in the selector and chart. Gaps and changes in quality definition interrupt comparable trends. Do not interpret a jump at a model change as data improvement without checking the change. Refreshing the browser does not recalculate stale records.
Investigate findings
- Read the ranked problems, including field, severity, and occurrence count.
- Check whether the ranking reports additional types beyond its stored limit.
- Use See the records to inspect the affected records.
- Open one record’s quality explanation and compare the finding with its value.
- Decide whether the source value, dataset rule, or cleaning configuration needs correction. Test it before applying it to a broader load.
- Verify the current record after the write, then take a new picture to compare the aggregate result with the earlier observation.
Counts of findings and counts of affected records differ: one record may carry several findings. A record with errors may also have warnings. Do not add the two record counts as though the categories were disjoint.
In the initial Aurelia sample, all 378 records have warnings and 17 also have
errors. Ana’s CRM-0001 scores 93 because its phone is not in canonical form.
The quality tutorial checks a proposed repair
without writing; the API correction exercise
persists it, verifies 100, and restores the original values.
Read the distribution and coverage
The histogram groups scores into ten ranges: 0–9 through 80–89, then 90–100. The final range includes 100. Read counts as well as bar heights and inspect the low-scoring tail before relying on the mean.
Coverage is the number measured under the picture’s quality definition divided by its total current-record count. History records are excluded. When no records are measured, an absent average differs from an average of zero.
Understand the score
Use the quality concept for weighting, rounding,
error caps, repeated values, and missing values. The current record explanation
shows the contributions used in its calculation. A stored state other than
CURRENT requires attention before comparing its stored score with a new draft.
Read pictures through the API
The metrics reference covers daily snapshots and on-demand measurements. Their aggregates describe the whole table, even for a reader whose record access is restricted to a row scope. Account for that boundary when designing access to sensitive aggregate information.