

On this page
Artifacts, assets, and regions
Learn how supplied files become an inventory of assets and relationships, and how Briefing, Landscape, and Detail organize their investigation.
A source artifact is a file or package you supply. An asset is an object represented in the analysis. A region groups related assets for system-level investigation. Keeping these three levels separate makes counts and diagrams much easier to interpret.
Source artifacts
Artifacts describe the system in the language of its source platform: scripts, job definitions, object exports, routines, or metadata packages. One file can contain several transformations or structures. A package can also describe a single object across several files.
The number of input files therefore differs from the number of analyzed assets. Two large scripts can describe a larger system than dozens of small definitions. Use the project inputs to understand what was supplied and the asset inventory to understand what is represented.
Assets and relationships
In a data-system analysis, you can encounter the following kinds of objects. The available inventory depends on the supplied platform and material.
| Object | What to investigate |
|---|---|
| Transformation | Processing that reads, changes, combines, or produces data |
| Entity | A represented data structure or business object |
| Source | An origin from which data enters the represented flow |
| Dataset | A data shape or collection represented in the analysis |
| Metric | A calculation or measure used by the system |
| Relation | A relationship between represented objects |
| External reference | A dependency whose implementation may be outside the supplied scope |
| Subroutine | Reusable processing called from other logic |
| Sequence | An ordering of processing activities |
| Test | A recorded test definition or check |
Relationships connect these objects. To investigate an output, follow what produces it, what that processing consumes, and which shared objects it uses. The object name is a starting point; the surrounding flow explains its role.
Regions
Landscape groups related objects into regions so you can examine a large system without opening every asset first. A region has members and connections to other regions. Its size and connections help explain its significance in the system.
A region can be a useful candidate for an assessment work package. Compare its members and dependencies with business ownership before assigning work: an analysis grouping need not coincide with a department, application, or deployment unit.
Three levels of investigation
| View | Unit of investigation | Typical question |
|---|---|---|
| Briefing L0 | The whole analyzed system | What does this system do? |
| Landscape L1 | Regions and their connections | Which areas should I investigate together? |
| Detail L2 | An individual asset | How does this object contribute to the result? |
These views provide different levels of detail, not separate source inventories. A system-level count and a region-level indicator can nevertheless use different populations. Read the measure’s explanation when comparing them.
Follow a reporting example
Consider a synthetic monthly-revenue flow. Order data is combined with exchange rates, converted into a reporting currency, and aggregated by month.
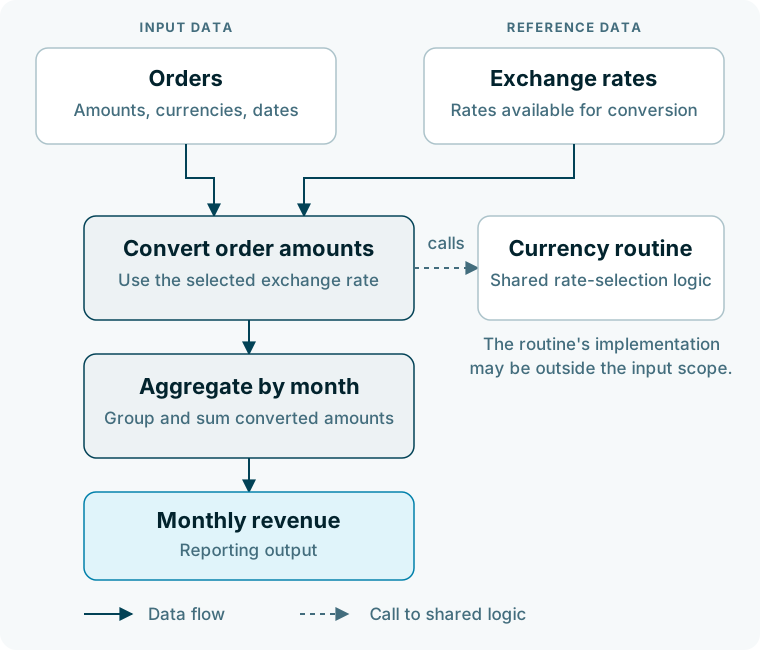
The supplied script is an artifact. Its conversion and aggregation operations are processing to investigate. The exchange-rate input and shared routine are dependencies. Landscape helps you locate the surrounding area; individual asset review addresses how the conversion and aggregation work.
If the script calls the routine but its implementation is absent, the call still identifies a dependency. The project then supports a question about that boundary, while rate-selection behavior remains to be established. See Projects and analysis scope.