

On this page
L0 briefing
Read every L0 widget: system identity, architecture diagram, MEI, confidence, completeness, composition, key logic, assessment, and limitations.
Briefing L0 is the system-level view in Understand. Its widgets explain the system’s purpose and scale, summarize effort and analysis quality, and identify where to investigate next.
Open an analyzed project, select Understand, then Briefing L0. Keep the source scope available so that you can compare the summary with what was intended for assessment. The widgets describe the current available result; some sections appear only when the analysis contains their information.
Screenshots show the reference demo unless marked as an illustrative example. Identifying organization names and paths have been anonymized in browser captures; measurements and analysis gaps are retained. Values depend on the analyzed project. Select an image to view it at full size.
System identity and description
The opening block shows the system name, source context, and a description of its purpose. Use it to orient a reviewer: what enters the system, what processing it performs, and which outputs matter.
Read the ✦ AI (announced as AI-inferred to screen readers) marker where shown. The description is a useful entry point into the source, but a business term can need confirmation by the source owner. If the purpose does not match the intended scope, check the input package before interpreting the rest of the page.

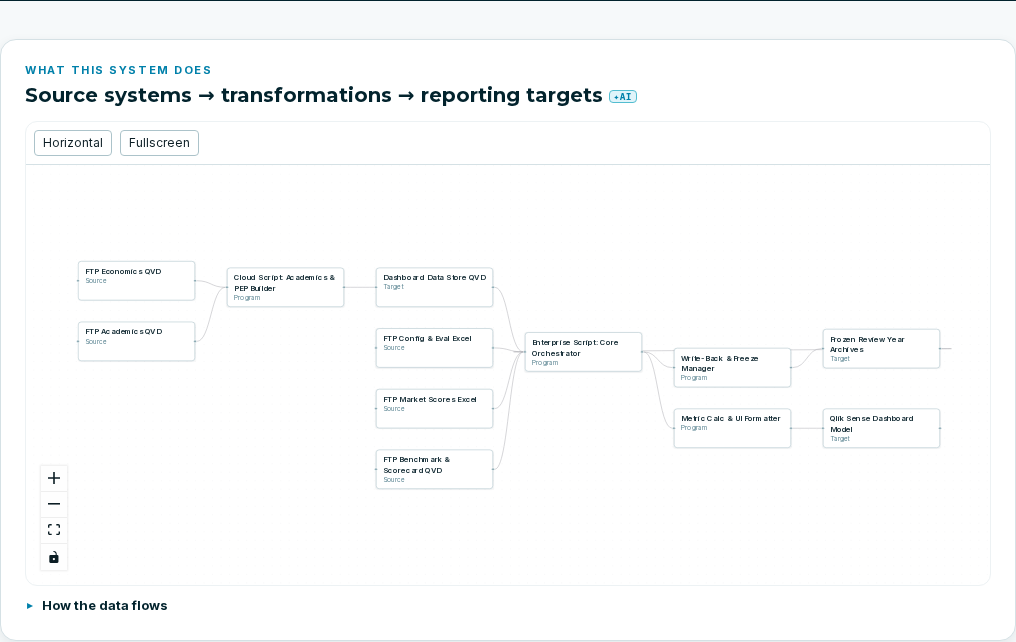
Architecture diagram: What this system does
The architecture widget presents the principal parts and connections. Trace a path from an input or entry point through processing to an output. The diagram helps you recognize the overall shape before inspecting individual assets.
Use the available orientation, zoom, fit, and Fullscreen controls to read a large diagram. Changing its layout changes the presentation, not the analysis. Expand How the data flows in the data-estate view to read the narrative associated with the diagram. The application-estate view uses What this application does, Programs → calls → dependencies, and How the system runs.
For a monthly-revenue assessment, locate order preparation, exchange-rate inputs, and the reporting output. At this stage, establish the route. The exact conversion expression belongs in L2.

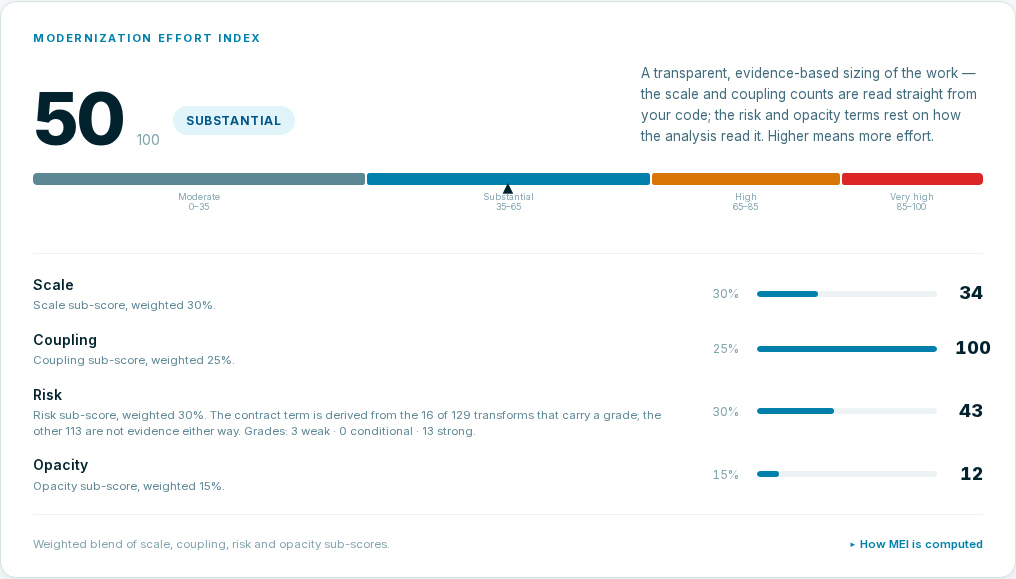
Modernization Effort Index
The MEI widget shows a headline score on a 0–100 scale, its displayed effort interpretation, and the contributing factors. Higher values indicate more modernization effort according to the analysis.
| Factor | What to investigate |
|---|---|
| Scale | The volume and size of the represented processing |
| Coupling | Connections and dependencies that coordinate changes across the system |
| Risk | Recorded behavioral-contract and warning evidence |
| Opacity | Missing detail and unknowns that need further investigation |
Expand How MEI is computed to read the method and its qualifications. Read available evidence and coverage in the individual factor rows. When counts are inferred, the panel states that Scale and Coupling were not counted from source. The contribution display explains why the headline takes its value; a missing contribution should not be read as measured zero effort.
Use the factors to choose the next question. High coupling directs attention to shared dependencies. High opacity directs attention to missing source or detail. The score is not an implementation duration, price, or staffing estimate.
Analysis Confidence
This widget reports the aggregate confidence recorded for the eligible assets, alongside a descriptive band. Read the aggregate with its measurement population and the distribution of asset detail.
Expand How this is measured. In Briefing, the population covers transformations, entities, sources, and metrics; assets without recorded confidence are excluded from the mean. The number therefore summarizes available confidence values, not the percentage of the whole source system proven correct.
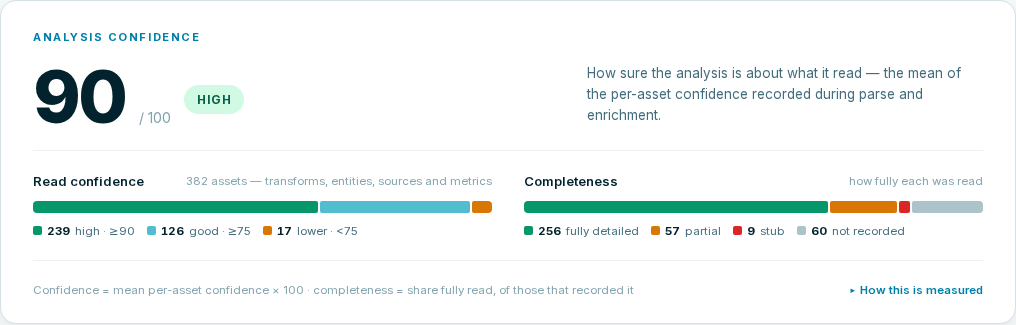
Completeness
The completeness portion distinguishes fully detailed, partial, stub, and, when present, not recorded assets. Read the counts and population as well as the visual distribution. A high mean confidence can coexist with partial assets or an unrecorded population.
Use the worked indicator example to see why confidence 90 does not mean 90% of assets are fully detailed. When a specific asset matters to your assessment, inspect its own completeness in L2.
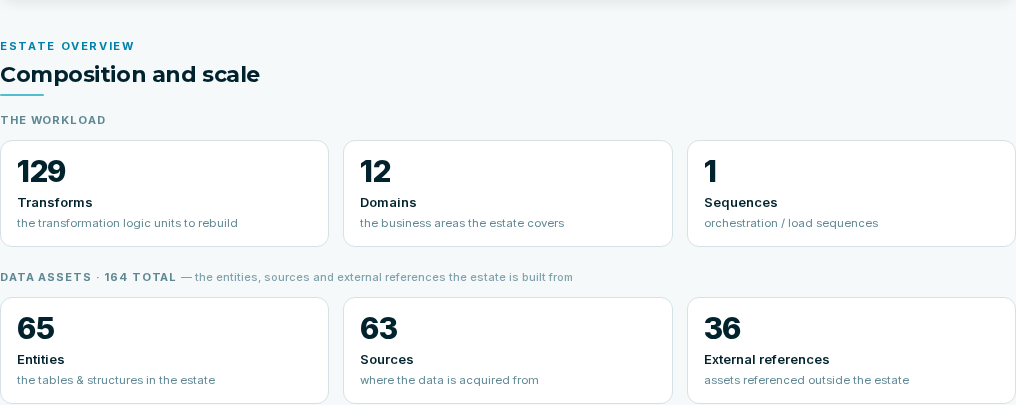
Composition and scale
This section separates the work performed by the estate from the data assets it uses. Read the label under each count: programs, transformations, and data structures are different units and should not be added as equivalent objects.
| Group | How to read it |
|---|---|
| Workload | The programs, transformations, or processing units represented in the system |
| Data assets | The represented objects and structures used by that processing |
| Individual count cards | The count and explanatory text for that type of object |
For data estates, the workload cards are Transforms, Domains, and Sequences; the data-asset cards are Entities, Sources, and External references. For application estates, the workload is Programs, Callable units, and Subroutines; the accompanying asset counts are Source files, Transforms, and External references.
The cards adapt to the estate and available information. A missing or unmeasured count is not a count of zero. Likewise, the number of analyzed objects need not match the number of uploaded files: one script can contain many transformations.
Use composition to frame the review. A system with substantial processing asks for investigation of transformations and calls; numerous structures with limited behavioral detail may call for additional source context.
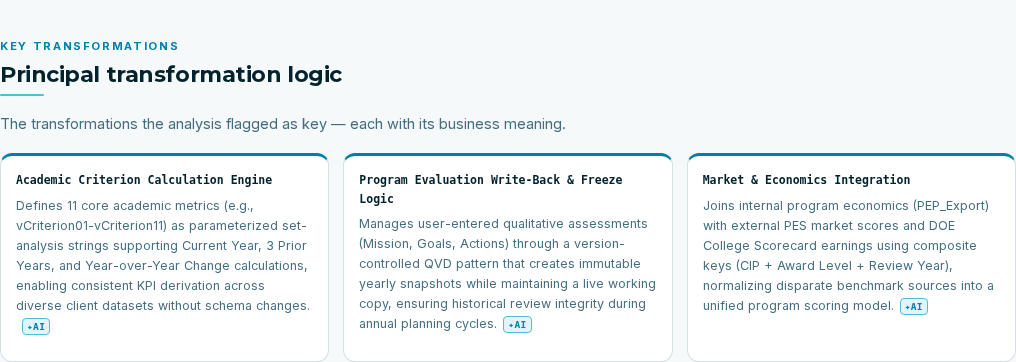
Key transformations or key programs
For a data estate, Key transformations / Principal transformation logic highlights selected processing and its business meaning. For an application estate, the corresponding section is Key programs / Principal program logic.
Read each card as a lead for investigation. Choose the one related to your question and locate its region or asset. These cards are a selected explanation, not the complete asset inventory; use Detail L2 to search the full available index. The section can be absent when no key units were recorded.
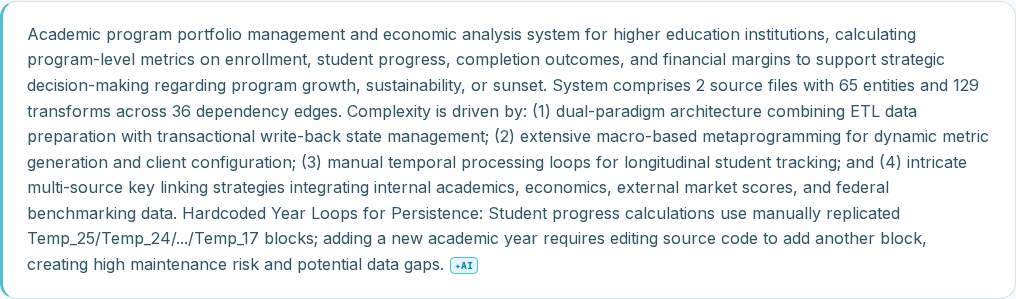
Assessment
What this means for the modernization brings the system-level observations into an assessment. A single ✦ AI marker can apply to the combined paragraph; it does not identify the origin of each sentence. Check its statements against the indicators and source evidence already examined.
Turn an important statement into a question you can check. “Shared currency preparation affects the reporting flow” leads to identifying its consumers in L1 and examining the conversion behavior in L2.
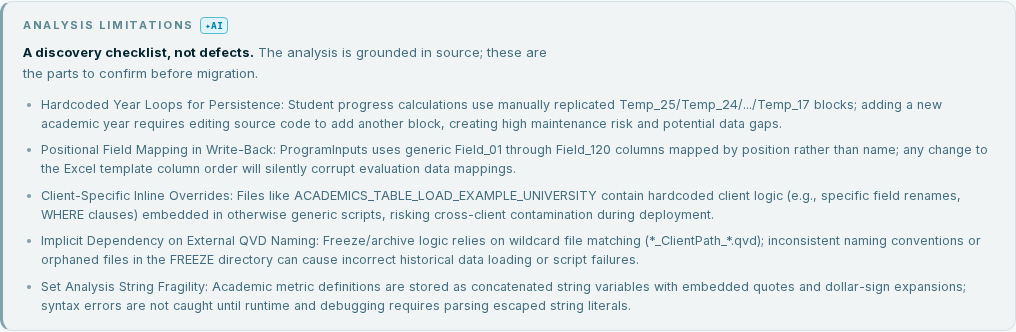
Analysis limitations
This widget is a discovery checklist. It identifies matters to confirm before migration, rather than declaring every listed item a defect in the source system. A missing dependency, incomplete detail, or uncertain interpretation leads to a different follow-up action.
For each item relevant to your scope, decide whether to obtain another artifact, inspect an existing asset, or ask a source specialist. Keep the outcome with the assessment instead of copying the checklist as an unverified defect list.
Explore the landscape
The final Explore the landscape action moves to L1. Before following it, choose a processing area and a question. For example: “Which regions rely on the same currency preparation as monthly revenue?” This gives the next view a specific purpose.

Verify the review and handle unavailable results
You should be able to explain the system’s purpose, distinguish its workload from its data assets, identify the factors behind its effort score, and name the next region or asset to investigate.
If the view reports analysis in progress, missing information, stale results, or failed enrichment, read that state before drawing conclusions. Retry reloads a result where offered; it does not itself rerun the analysis. Ask the project editor to resolve a missing or outdated result for the required inputs.