

On this page
Interpret analysis indicators
Read effort, confidence, completeness, and contract coverage with their populations and limitations before using them in an assessment.
Use effort, confidence, completeness, and contract coverage to understand different aspects of an analysis. Read each value with its population and method explanation before comparing systems or regions.
Screenshots show the reference demo unless marked as an illustrative example. Identifying organization names and paths have been anonymized in browser captures; measurements and analysis gaps are retained. Values depend on the analyzed project. Select an image to view it at full size.
Different indicators answer different questions
| Indicator | Question it helps answer | Check alongside it |
|---|---|---|
| Modernization Effort Index (MEI) | Where does the analysis indicate more modernization effort? | Scale, coupling, risk, opacity, and the evidence available for those factors |
| Analysis Confidence | What confidence is recorded for the assets included in the measure? | Included assets, assets without a confidence value, and completeness |
| Completeness | How much detail is recorded for the analyzed assets? | Fully detailed, partial, stub, and not-recorded categories |
| Contract grades in the Risk explanation | How much of the stated population has the contract evidence represented by this measure? | The denominator, grades, and ungraded or missing evidence |
Use the method explanation in the view you are reading. Similar labels in different views do not establish that the figures cover the same assets.
Interpret the effort index
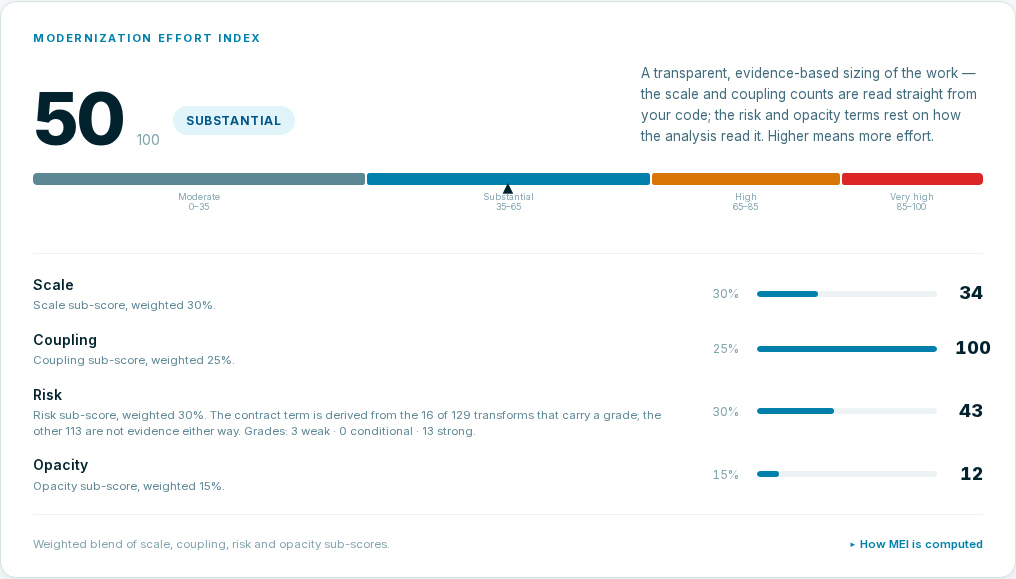
MEI is displayed on a 0–100 scale: higher values indicate greater effort according to the analysis. Briefing shows contributions for Scale, Coupling, Risk, and Opacity.
Use the contributions to identify what to investigate. A highly connected region raises different questions from one with substantial missing detail. Expand How MEI is computed to see the explanation associated with the current result.
A headline can still be displayed when a factor is unavailable. Read which factors contributed before comparing it with another result; an unavailable contribution is not evidence of zero effort.
Where the method states v1/uncalibrated, treat the displayed effort anchors as provisional rather than an independently calibrated estimate.
A score is not a duration, cost, staffing figure, or probability of successful modernization. Do not translate an effort band directly into a contractual estimate. Establish the work scope, technical constraints, and acceptance criteria separately.
Read confidence and completeness together
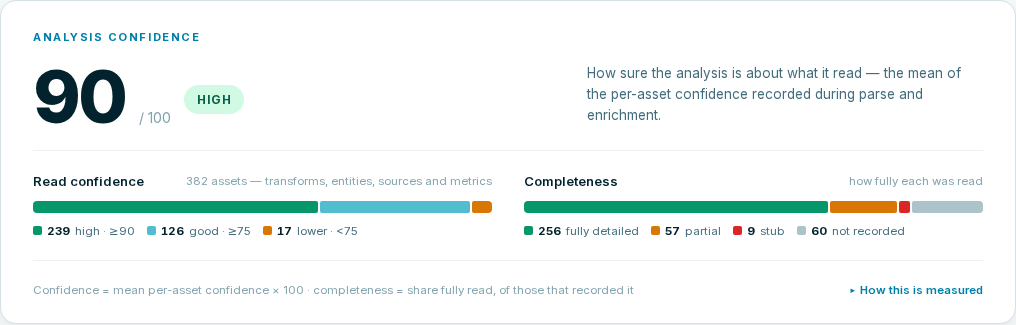
Confidence summarizes recorded confidence for the assets included in the measure. Assets without a recorded confidence value do not become zero-confidence observations simply because the value is absent.
The asset total can include assets without confidence values, while the visible confidence bands describe recorded values. Do not use that total as the denominator of the confidence mean.
The Briefing measurement covers transformations, entities, sources, and metrics. Other views or individual assets can show confidence over a different population. Read the view’s explanation before comparing those values.
Completeness describes how fully an asset is represented. Partial, stub, and not recorded identify different limitations; none should be silently counted as fully detailed. Read How this is measured to understand the population used in the displayed result.
A high confidence figure does not prove that the whole system was supplied, that all its behavior is understood, or that an implementation has passed tests.
A worked comparison
Consider three synthetic assets in a Briefing confidence population. The values below illustrate the calculation; they are not results from a supplied sample.
| Asset | Recorded confidence on a 0–100 scale | Completeness |
|---|---|---|
| Transformation A | 80 | Fully detailed |
| Entity B | 100 | Partial |
| Source C | Not recorded | Not recorded |
The confidence mean uses the two recorded values:
(80 + 100) / 2 = 90
It does not use (80 + 100 + 0) / 3: a missing confidence value is excluded, not converted to zero. Of the two assets with completeness recorded, one is fully detailed. The third asset remains a separate not-recorded observation.
A confidence value of 90 therefore does not mean that 90% of the assets are fully detailed. Keep the mean, completeness categories, and unrecorded population separate in your assessment.
Read contract evidence in context
For the meaning of a behavioral contract, see Analysis evidence and limitations. Where a measure uses graded contracts, check how many eligible assets actually carry a grade and what the remaining population represents.
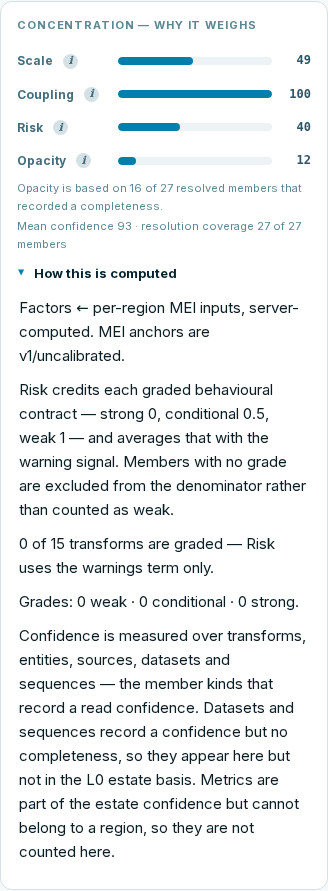
For example, a risk explanation based on a subset of graded transformations does not establish equivalent evidence for every transformation in the system. Read the coverage before comparing regions. In Landscape, when a region has neither graded contracts nor attributed warnings, risk is unmeasured: Heat shows unscored, Concentration not measured, and Layers marks the MEI with an asterisk explained by its risk unscored legend. Warnings alone can contribute a risk measurement even without graded contracts. None of these unmeasured labels means risk is zero. Briefing can still show a numeric Risk value without graded contracts; read its warning-only explanation rather than applying the Landscape display rule to that headline.
In the example below, none of the 15 eligible transformations has a grade. The panel therefore explains that Risk uses the warning signal only. This differs from a region with no eligible transformations.
A contract grade does not demonstrate that you have executed and passed an acceptance test. Record the conclusion and its supporting evidence separately.
Compare results consistently
Before comparing two figures, establish whether they refer to the same scope, input revision, population, and measurement definition. An analysis with more supplied artifacts can change counts and coverage without showing a change in the original system’s behavior.
When sharing a figure, include the question it supports, the relevant population, and any missing or partial evidence. If you cannot establish those conditions, report the values separately and explain why they are not directly comparable.