

On this page
L1 landscape
Read the L1 distribution widgets, four lenses, selected-region panels, flows, and member links to investigate the structure of an estate.
Landscape L1 organizes the analysis into regions and connections. Its widgets answer two questions: how work is distributed across the estate, and what lies inside and around a selected region.
Open an analyzed project, select Understand, then Landscape L1. Begin with a question from the Briefing. The captions and object vocabulary depend on the estate profile and available result.
Screenshots show the reference demo unless marked as an illustrative example. Identifying organization names and paths have been anonymized in browser captures; measurements and analysis gaps are retained. Values depend on the analyzed project. Select an image to view it at full size.
Distribution widgets
Read the four summary tiles before selecting a region. Open the information badge for a definition and How this is computed for the measurement method.
| Widget | What it shows | How to use it |
|---|---|---|
| Regions | The number of represented business or technical groupings | Establish the size of the board, not the number of source files |
| MEI spread | The lowest and highest regional MEI values, with the available estate reference | Identify whether effort is broadly similar or concentrated in a few regions |
| Mass concentration | The share of member mass in the largest regions, with the number of regions used | Assess whether a few regions dominate the represented estate |
| Independent regions | Regions meeting the current independence criteria | Find candidates for a bounded investigation, then inspect their actual interfaces |
Read the explanations alongside the figures. A candidate flag and a hub flag can coexist. A candidate count is not approval to migrate the region without examining its dependencies. Member mass describes represented membership, not source lines, runtime load, or elapsed work.

The available lenses depend on the project profile. Data estates prefer Layers; application estates prefer Clusters. If the preferred lens is unavailable, Landscape opens Heat. A lens may be hidden when it does not apply to the available result.
Heat: compare effort factors
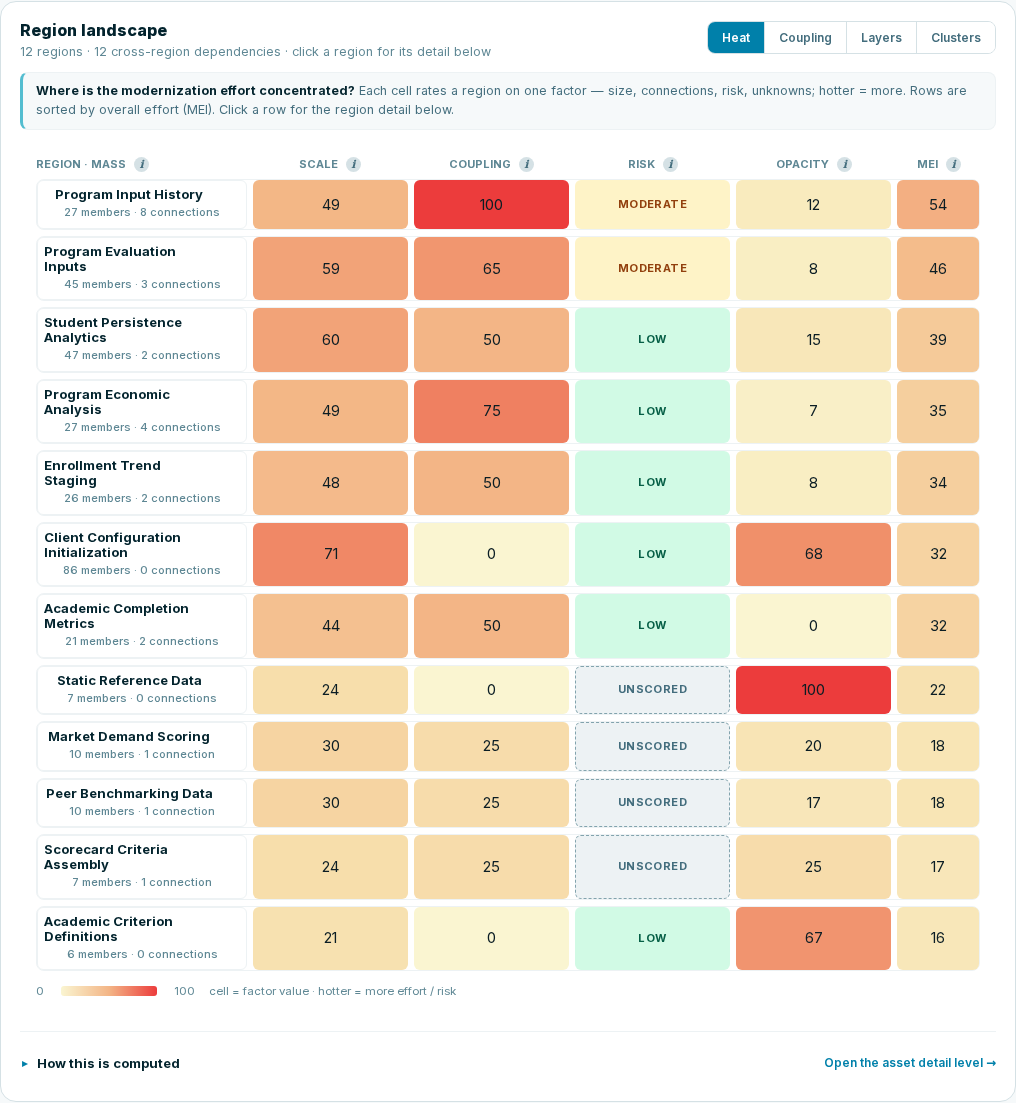
Heat displays regions as rows, sorted by overall effort. Its columns include overall MEI and compare the effort factors: size, connections, risk, and unknowns. Hotter cells indicate more of that factor. Risk uses low, moderate, or elevated bands, or an unscored state; Opacity can also be unscored.
- Locate the region related to your assessment question.
- Compare its factor cells with neighboring rows.
- Select the row to open Region detail below the board.
- Read the numerical factor explanation in Concentration — why it weighs.
A high scale cell suggests substantial material to inspect. A high coupling cell suggests coordination with other areas. An unscored risk cell requires reviewing the evidence coverage; it does not establish low risk.
Coupling: size and connections
Coupling plots connections horizontally and size vertically. Bubble size represents effort. A large region toward the left is relatively loosely coupled; a region toward the right is highly connected.
The plot marks carve-off candidates and hubs. A region can carry both markers, so read the distribution tile and selected-region interface before choosing it as an independent scope.
Select a bubble to inspect the region. Where several regions share the same coordinates, the focus area offers the other co-located regions so that you can select the intended one. Plot position alone does not uniquely identify a region.
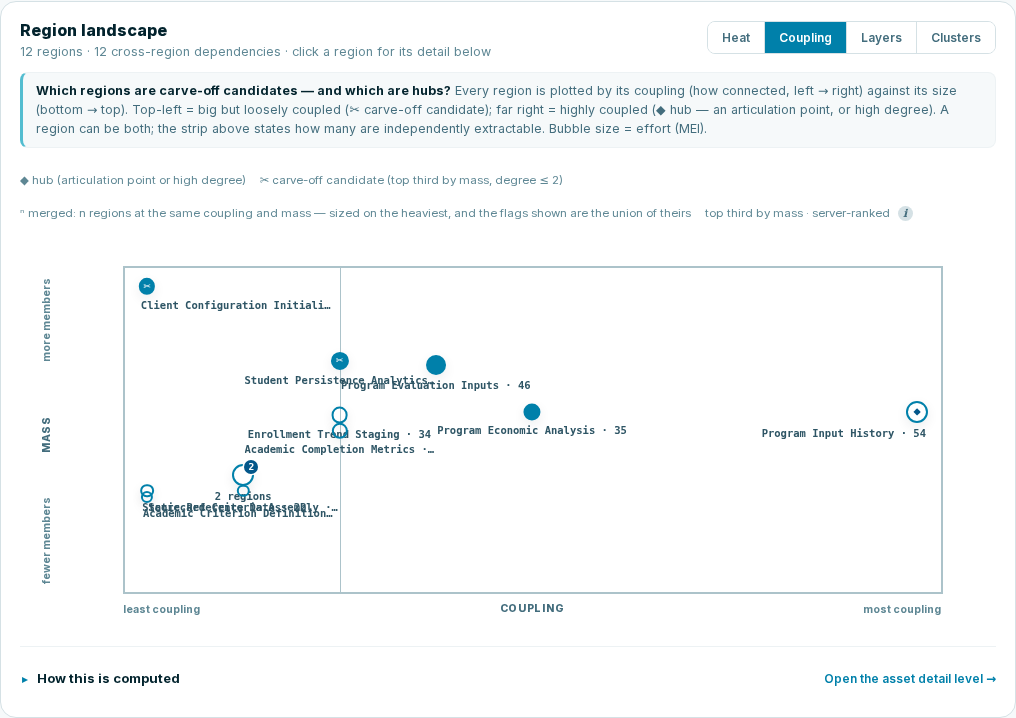
The reference Coupling screenshot contains overlapping labels. Select a region and read its focused detail to establish its identity; enlarging the image does not separate overlapping names.
Layers: dependency direction and depth
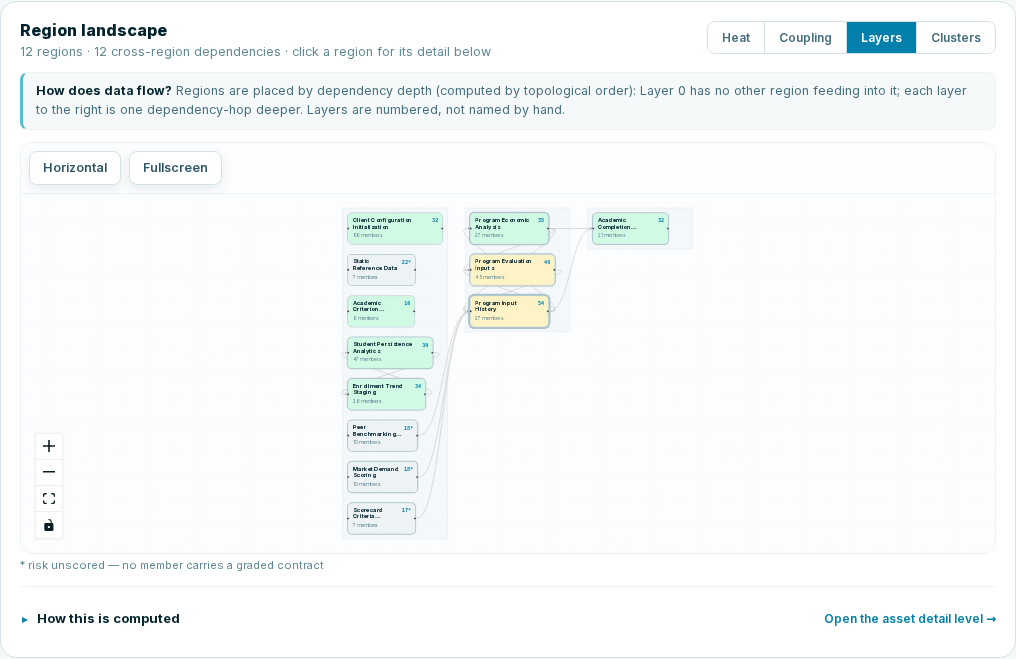
Layers arranges regions by dependency depth. In the ordinary acyclic reading, Layer 0 has no other region feeding it; later layers lie further downstream. Follow the connections to see what feeds the selected region and what consumes its results.
Use the diagram’s orientation, zoom, fit, and Fullscreen controls where available. Select a region node to open its detail. Read its color or unscored marking together with the legend rather than treating position as an effort score.
Layer numbers organize the dependency view. A delivery sequence also needs transition interfaces and testing, so do not interpret layers as deployment waves.
Clusters: related workstreams
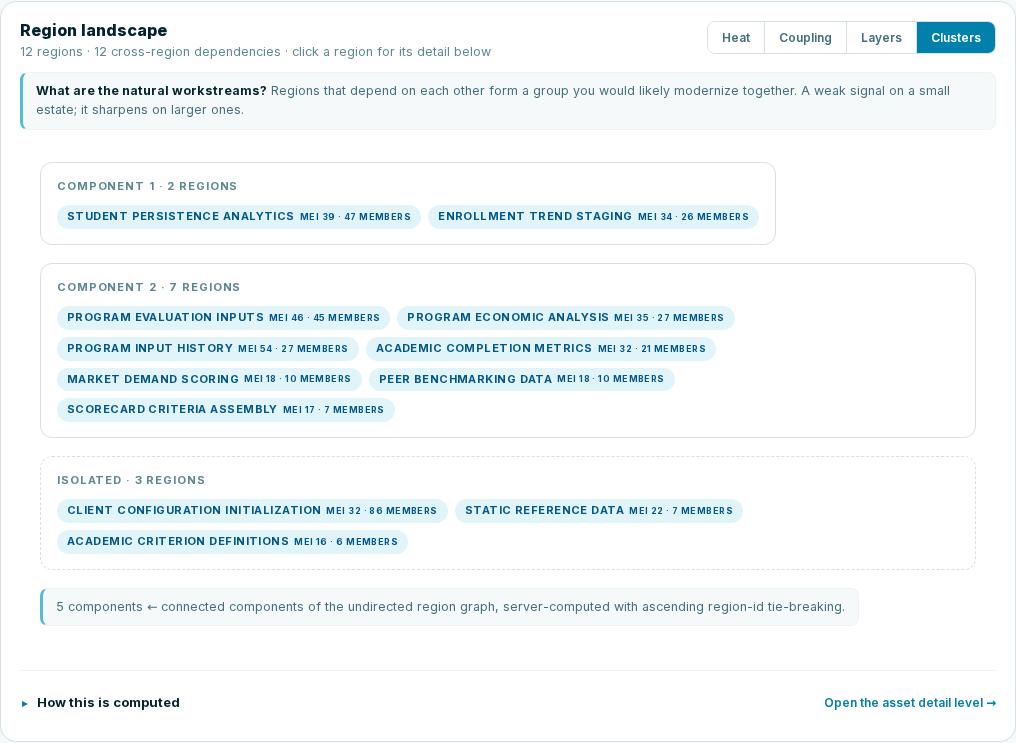
Clusters groups connected regions. Use the groups to ask which parts are likely to require coordinated investigation or change. Select a region within a group to inspect its own boundary.
The grouping can be less informative for a small estate. Compare the members and cross-region interfaces with the business scope before assigning a work package or team.
Reading aids and method panels
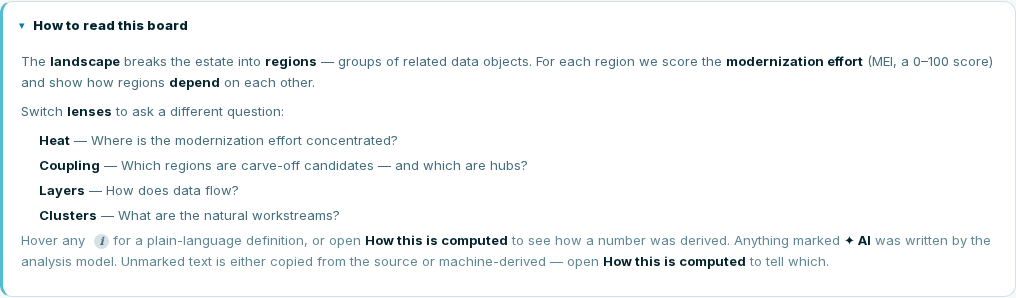
How to read this board, the lens caption, and the legend explain the visual encoding and markers. How this is computed explains the active measure or lens. Use the information badge to distinguish definitions from method details. ✦ AI (announced as AI-inferred to screen readers) marks generated names or descriptions where applicable.
These controls explain the analysis already on screen. Changing a lens or opening an explanation does not start another analysis.
Region detail: identity and headline metrics
Selecting a region opens its name and description, MEI, member count, connection count, and confidence where recorded. Check that the selected region matches your question before interpreting its cards.
The name or description may be inferred. The counts describe the represented members and relationships. A confidence value summarizes the available member signals; a not scored message identifies missing measurement, not zero quality.

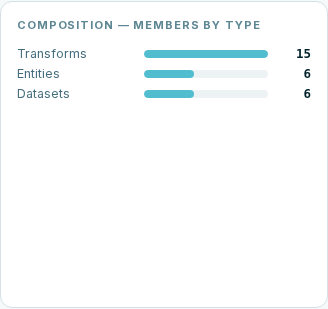
Composition — members by type
This card lists the region’s object types, their counts, and available subtype breakdowns. Use it to see whether the region is dominated by transformations, data structures, or other represented objects.
The bars are scaled within the selected card: the largest count fills its bar. Compare printed counts when moving between regions. Equal bar widths in two regions do not mean equal object counts.
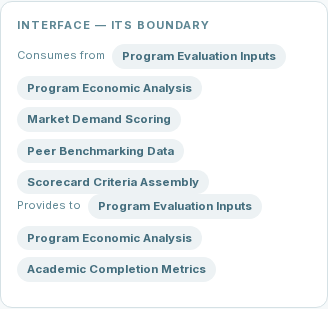
Interface — its boundary
Consumes from identifies regions feeding the selection. Provides to identifies regions that consume its output. Select an available peer button to move the focus to that region and continue tracing the boundary.
An empty direction is shown explicitly. A self-contained message concerns the represented cross-region dependencies; compare it with any external dependencies recorded in your input scope. A named peer with no available destination cannot be investigated by following a region link.
For monthly revenue, inspect the upstream rate-preparation region and downstream reporting consumers. Record which side owns the interface during a proposed change.
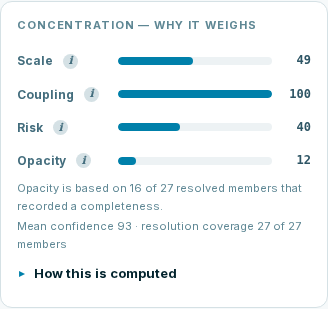
Concentration — why it weighs
This card separates Scale, Coupling, Risk, and Opacity. Read each value with its definition. Unlike composition bars, these factor bars use their factor scale rather than the largest value in the current card.
Missing risk or opacity measurements are identified as not measured. The partial-index note explains how much of the index lacks measured input. Keep that note with a regional score when comparing candidate work packages.
The confidence line also reports resolution coverage: how many members could be associated with the available analysis. That count is not necessarily the number contributing a recorded confidence value to the mean.
Expand the method panel to inspect the available behavioral-contract coverage, including weak, conditional, strong, and ungraded cases. Also read the population: L1’s regional confidence can include different object kinds from L0’s estate confidence. See Analysis indicators.
Region flows
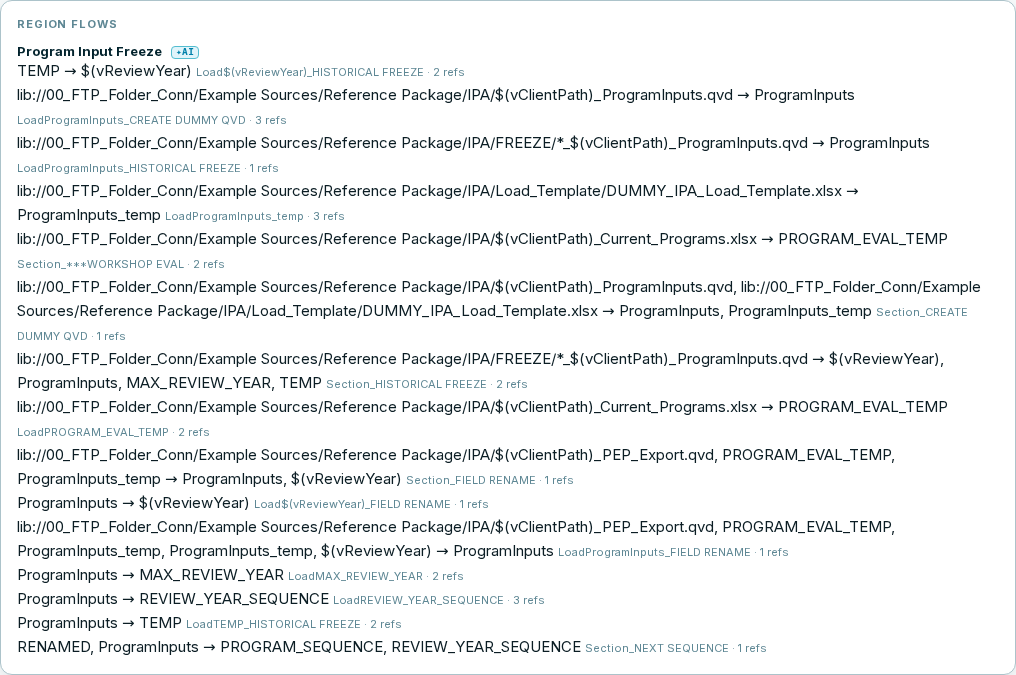
Where recorded, Region flows lists named flows and their steps in order. Each step can show a technical name and a reference count. Use this as a guided reading of activity within the region, then inspect the corresponding assets for the detailed behavior.
The widget is conditional: a region without recorded flows may have no flow card. This does not establish that the source system performs no processing.
Members and Open in L2 Detail
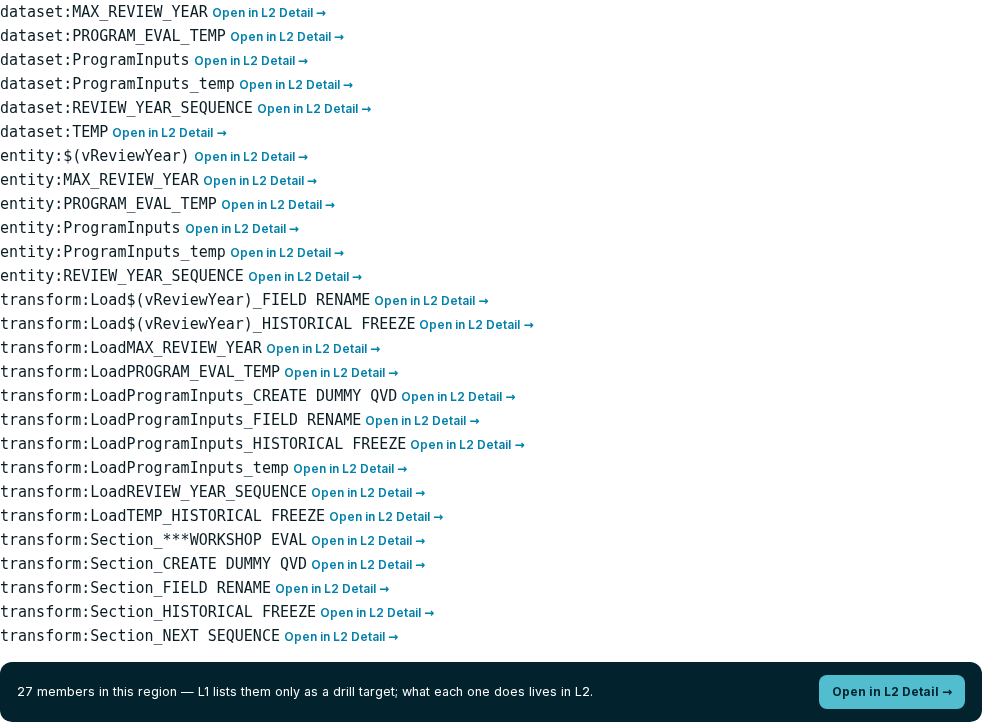
The members list identifies the assets belonging to the region. Use Show all when offered to expand the list. Select an available Open in L2 Detail link beside a member to investigate that asset; the general L2 action opens the index.
A member marked No asset detail to link to remains part of the displayed membership but has no navigable detail destination. Record that gap if its behavior is required for your assessment.
Verify a candidate boundary
After using the board, record the region, its important incoming and outgoing interfaces, the factor driving investigation, and the assets that need further review. A useful conclusion explains both why the boundary is worth examining and which dependency might require changing it.
If a required region or connection is absent, compare the analysis with the input inventory. Resolve missing material or result availability before treating that absence as a property of the original system.