
On this page
L2 spotlights
Interpret the Field map, Schema, Flow, Dependency, Formula, Relationship, and generic Detail widgets in an asset investigation.
L2 chooses a Spotlight according to the asset and information available. Each widget makes a particular part of the recorded behavior easier to inspect. Use its summary, legend, and gap messages together with the dossier and source.
Screenshots show the reference demo unless marked as an illustrative example. Identifying organization names and paths have been anonymized in browser captures; measurements and analysis gaps are retained. Values depend on the analyzed project. Select an image to view it at full size.
Field map: Source → target fields
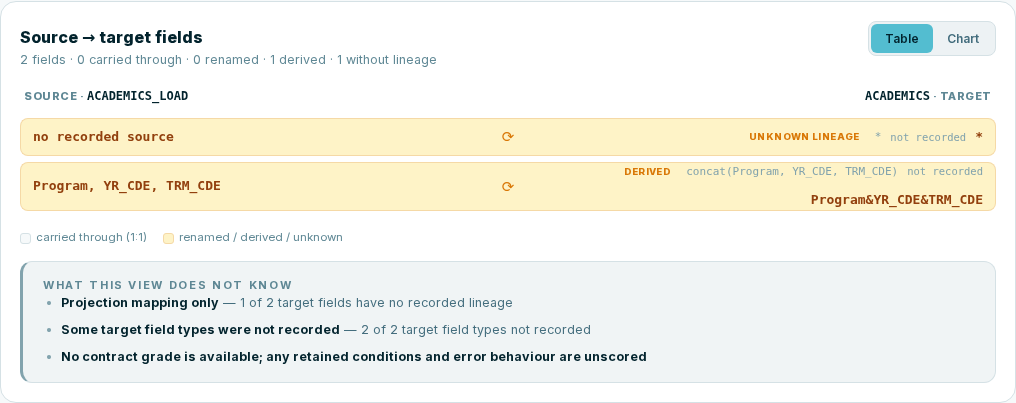
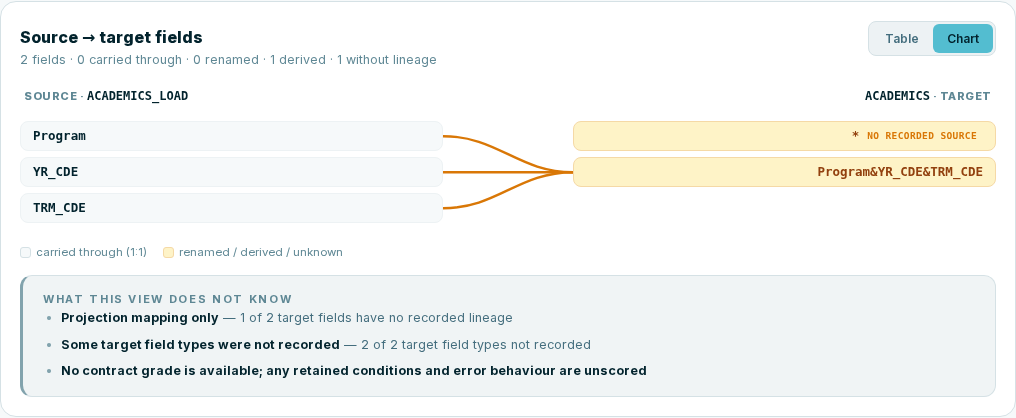
The summary counts fields that are carried through, renamed, derived, or without recorded lineage. In Table, each row connects the recorded source field or fields to an output field, with an expression and target type where available.
| Classification | Meaning |
|---|---|
| Carried through | A recorded one-to-one field pass-through |
| Renamed | A field carried under a different name |
| Derived | An output associated with a transformation or expression |
| Unknown lineage | The field’s contributing source is not recorded |
The table initially concentrates on changed fields. Use show … carried through (1:1) fields to expand the unchanged group, and the corresponding hide control to collapse it. Chart presents the recorded mapping graphically; Table returns to the row view. Read the full expression and contributing source names when a short visible label is insufficient.
A not recorded type or no recorded source is a specific missing fact. It is not evidence that the output has no type or is created without an input. Check the source panel to investigate the expression and its context.
Schema: Fields
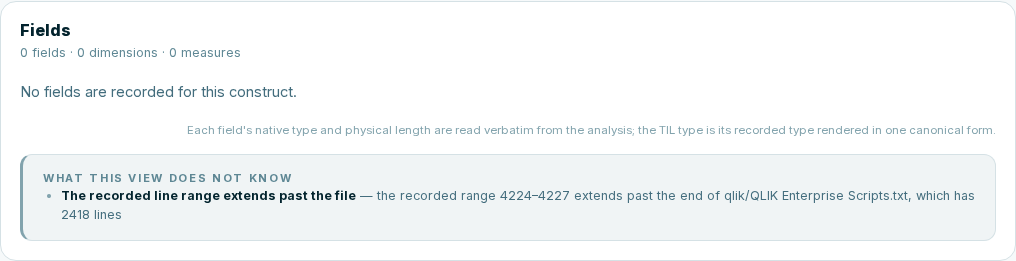
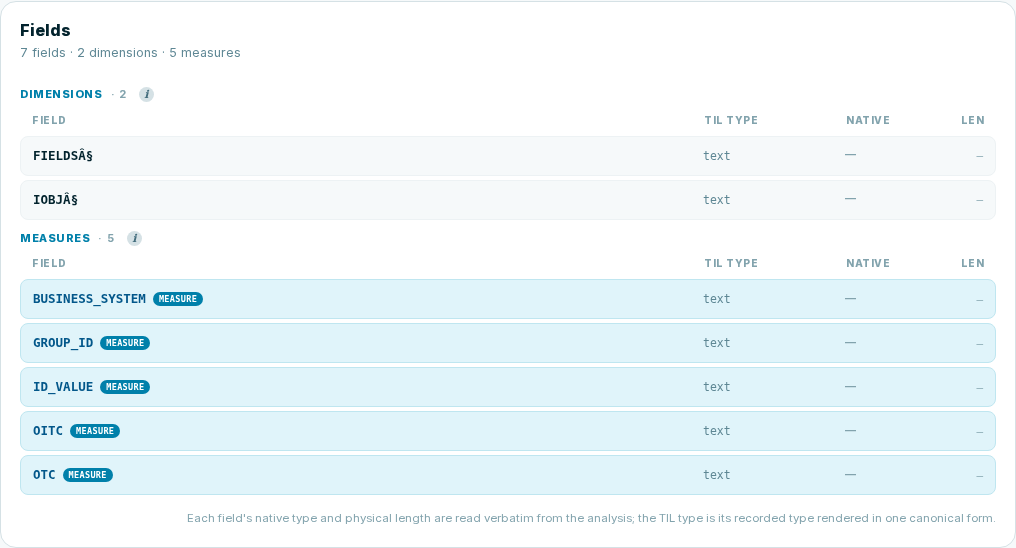
This widget groups fields by their recorded classification and reports the number in each group. When the available SAP type evidence supports that classification, the labels are Characteristics and Key figures. A classification based on recorded field roles uses Dimensions and Measures, including for SAP BW assets without that type evidence. The information badge explains the basis used for the selected structure. Unclassified keeps fields whose role could not be established visible.
Read the field name, TIL TYPE (represented type), native type, length, and available role information together. The native type preserves source-platform context; the represented type provides the analysis view. A missing length or type is shown as unavailable rather than invented.
Use the grouping to ask which fields identify or slice the data and which values are aggregated. It does not establish a business rule such as uniqueness without the corresponding evidence. A structure with no recorded fields has no field inventory to inspect; return to the source definition or missing copybook.
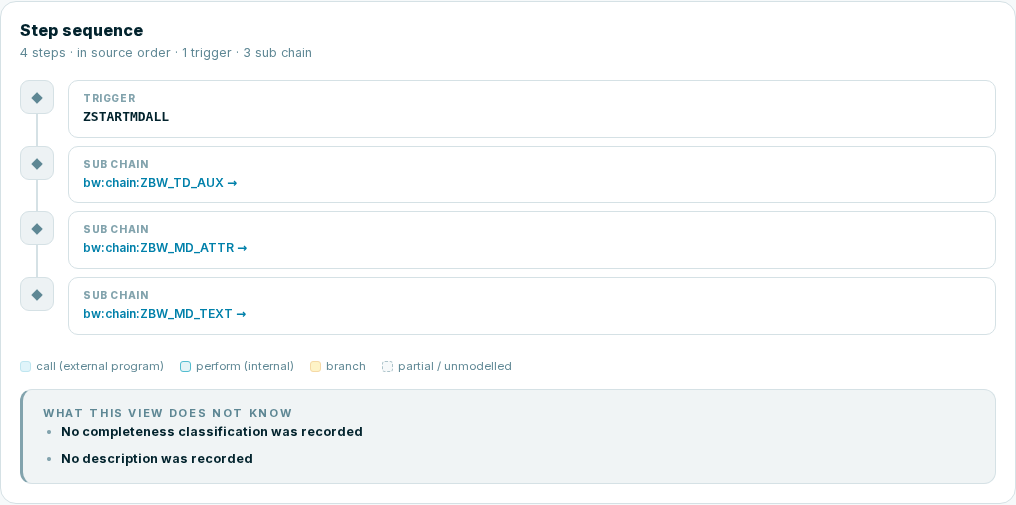
Flow: Step sequence
Flow presents the recorded steps in source order and summarizes their types. The sequence distinguishes calls, performed routines, branches, loops, termination, and partially understood steps. It also represents orchestration, including SAP BW triggers and subchains. Read each step’s type, label, linked target, and available arguments. Use the source panel for conditions and line context.
Follow an available linked target to investigate the called or performed behavior. A partial step marks a gap in the represented processing; retain its source context when deciding what to inspect next.
The recorded order describes program text or orchestration steps. Branches and loops determine the path of a particular execution, so the sequence is not a runtime trace. For an application review, check the failure path as well as the successful path.
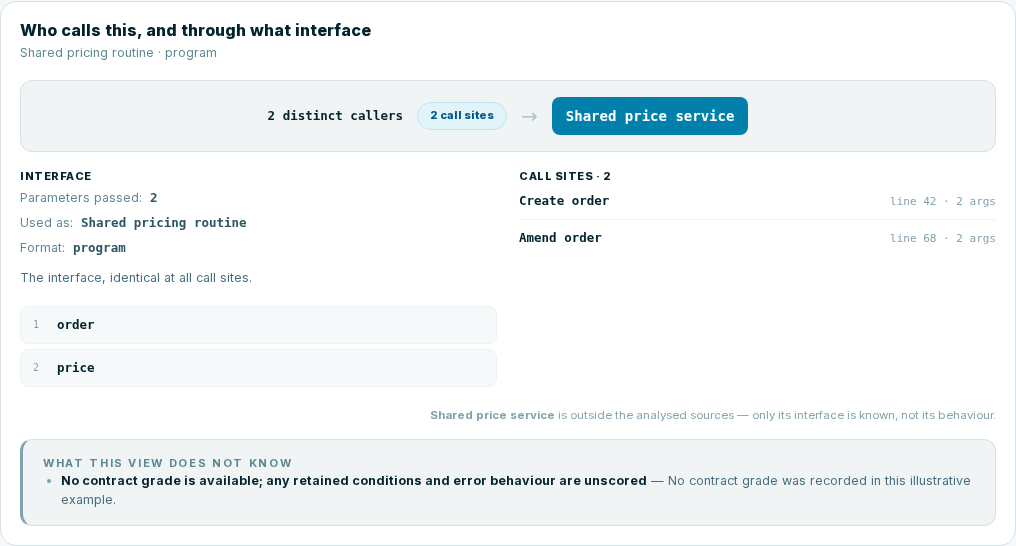
Dependency: Who calls this, and through what interface
The headline distinguishes distinct callers from call sites. One caller can invoke the same dependency more than once, so these counts need not match.
The Interface panel shows the recorded parameter count, role, format, and argument names when available. Read whether the shown interface is identical at all call sites or comes from one recorded site. The view identifies differing arities rather than inventing a single shared signature.
Call sites lists the caller, source line, and available argument count for each occurrence. Use it to identify consumers of a shared routine or external operation before changing its contract.
A recorded zero-argument call is different from an unrecorded argument list. An interface can be known while the callee’s implementation remains outside the project. Use the source owner to resolve that behavior.
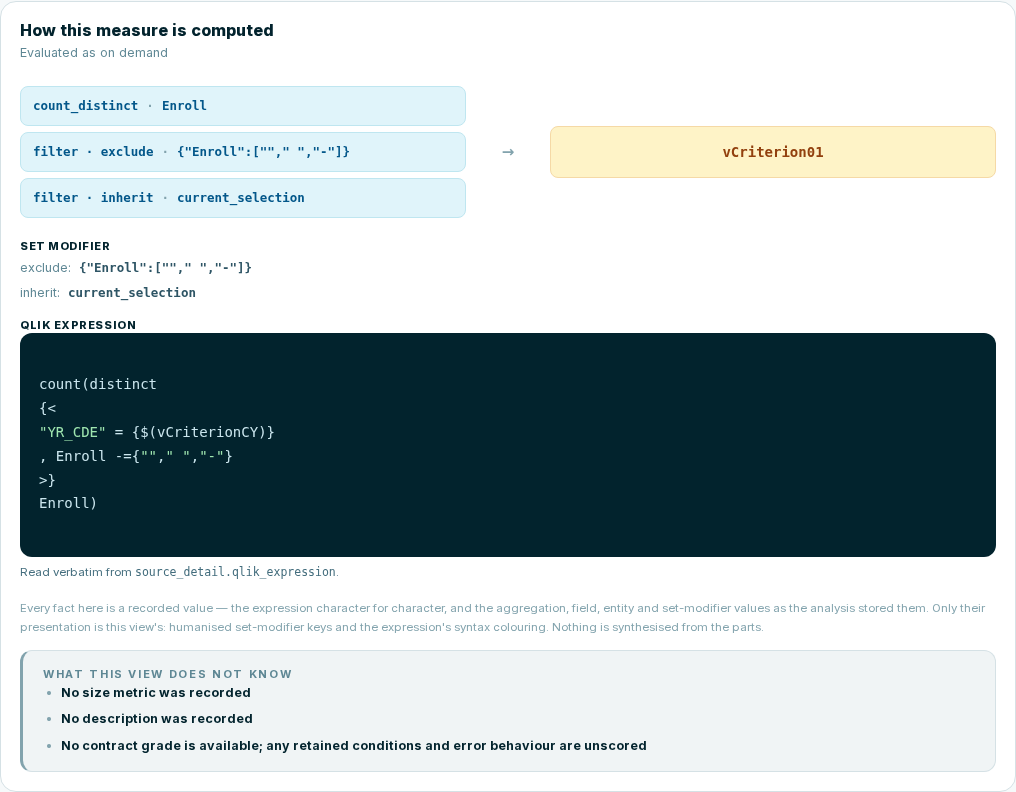
Formula: How this measure is computed
Formula presents recorded aggregation, field, entity, and filter information leading to the measure. Read the evaluation context shown with the summary. Set modifier supplies additional selection context where recorded.
For a Qlik measure, Qlik expression displays the verbatim expression when available. Compare it with the summarized parts before explaining a calculation. The view does not manufacture an expression from the aggregation and field labels when the original expression is absent.
Use this widget to investigate questions such as which rows contribute to a measure and whether a selection is overridden. If no aggregation, field, or filter is recorded, the empty-state message identifies what remains to obtain.
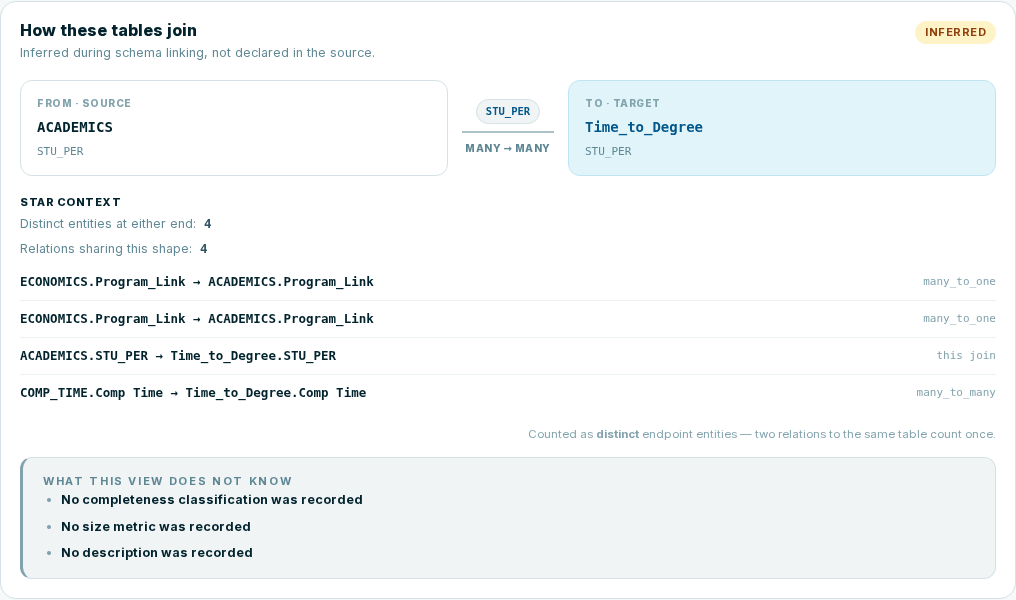
Relationship: How these tables join
The join view places the source and target entities at either end, with field information, the join key fields, and recorded cardinality where available. Read assumed or unknown cardinality as such; a drawn relationship does not by itself prove source uniqueness.
An INFERRED marker identifies a relationship inferred during schema linking, not declared in the supplied source. Check its evidence before treating it as a source-defined join or contract.
Star context lists related joins and the number of distinct entities at either end. Two relations involving the same table contribute two relations but one distinct table to that count. Use the context to investigate shared join patterns and potential effects on row multiplication.
If an endpoint or join field is missing, compare the relationship with the source expression. Do not fill the gap from a familiar naming convention alone.
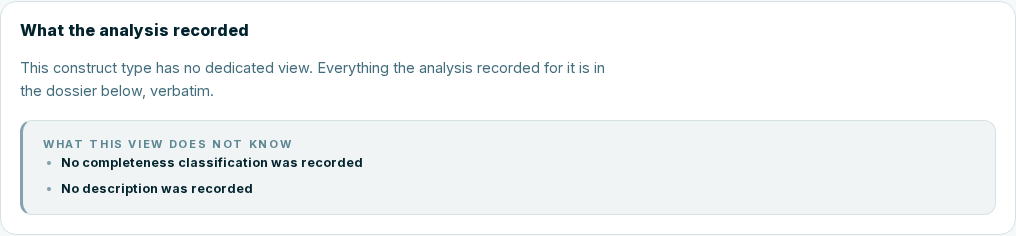
Detail: What the analysis recorded
The generic widget states that no specialized Spotlight is available and directs you to the dossier for recorded properties. Read its gap messages with the dossier and source panel. A generic view does not imply the asset has no behavior; it means the available information is being presented without one of the specialized visualizations.
Legends and gaps
Each Spotlight can include a legend explaining the origin or interpretation of its values and a list of missing information. Read these before converting a visual observation into an assessment statement. The practical next step should identify the source or related asset needed to resolve the gap.